


We all know the advanced world is full of data that is involved in different fields. To handle different types of data, we use Artificial Intelligence (AI) and digital technologies. But for the handling of data, strong critical thinking skills are more important than ever.
Critical thinking is essential to make informed decisions, analyze situations logically, and solve complex problems effectively. These skills can be improved by using statistical tools that support evidence-based reasoning. These tools help you collect, organize, understand data, and interpret better results.
With statistical concepts, you can make better choices, solve problems, and support your ideas with facts. In this post, we will discuss how statistical tools can improve your thinking and help you succeed in education and in your career.
What is Critical Thinking?
Critical thinking is the ability to analyze information, question assumptions, evaluate evidence, and make smart decisions based on facts. It means not just reading that information, but also understanding it, challenging it when needed, and using different techniques to solve any data or problems.
Critical thinking is more beneficial for graduates when it is enhanced by collaborating with statistical tools. It allows graduates to:
- Interpret data accurately
- Identify patterns and trends
- Make predictions based on evidence
- Support arguments with real numbers
These concepts help young professionals to handle complex data fields of numbers and measure the uncertainty or rapid change in data by viewing patterns.
What are Statistical Tools?
Statistical tools are different statistical techniques that help collect, calculate, organize, analyze, and interpret data results using integrated software packages or formulas. They also help to understand information clearly and make conclusions based on real facts, not guesses.
Here, we discuss some well-known statistical tools that are used to analyze survey data in a better way. By leveraging these free online statistical tools or software perform calculations, visualize data, and interpret results.
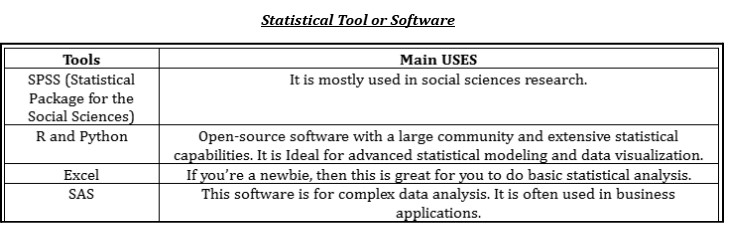
This software helps students handle large datasets and simplify complex calculations easily or quickly. Additionally, assist in the interpretation of results rather than tedious manual calculations.
For example:
- If we want to know the class average score? We use an average formula in Excel.
- If you want to see how much variation in test scores? Then use the standard deviation formula of Excel in Excel or the R language in R software.
- If you want to predict the future sales of any product? Then, perform regression analysis by using SAS software.
Essential Statistical Concepts Every Graduate Should Know
After knowing the statistical tool, you should grasp some important statistical concepts to improve your critical thinking. These concepts are not just for math experts or data analysts, they are essential for everyone, from healthcare professionals to business leaders, social scientists, and engineers.
Understanding of these concepts helps to interpret data, see patterns, and make better decisions. Some important concepts are given below:
1.) Mean, Median, Mode
Mean, median, and mode are 3 measures of central tendency in statistics. These parameters help to find the averages or trends of any data. Details of these measures are discussed below:
Name | Definitions | Formulas |
Mean | It is one of the most used measures of central tendency. This can be used to calculate the average of a dataset. | X̅ = (X1+X2+X3 +…+Xn)/n Xi = Given values n = total number of observations |
Median | The mean is used to represent the middle value of a particular set of data. | For Odd = [(n+1)/2]th For Even = (n/2) th + [(n/2) +1]th |
Mode | The most frequently appearing value in the data. | Most repeated value |
2.) Standard Deviation and Variance
This statistical concept means that the standard deviation shows how much the data values spread out from the average. Its value depends on the fluctuation of data. If the standard deviation is high, values are separated from the mean, and low values are close to the mean.
This can be calculated by using the following formulas:

Variance is another statistical measurement that is used to calculate the spread of numbers in a data set with respect to the mean. It is calculated by taking the square root of the standard deviation. With the help of this concept, we can explain how wide or narrow the distribution of data is.
3.) Linear Regression
This is another essential concept of stats for graduate students. Linear regression is used to guess the value of one variable based on the values of another. The predicted variable is called dependent, and the other one is called independent.
Linear regression can be found using the following formula:
Y = bx + a
- Predicted value of Y
- b = slope
- a = y-intercept
4.) Hypothesis Testing
Hypothesis testing is used to determine whether the results of an experiment are meaningful or not. It consists of the null and alternative hypotheses, and these 2 are always mutually exclusive. Its result tells us whether we reject or not the null hypothesis.
Its formula depends on the data type.
t or z = x̄ −μ / σ √ n.
- “x̄” is the sample mean,
- “μ” is the population mean,
- “σ” is the population standard deviation,
- “n” is the sample size.
5.) Skewness
It indicates how symmetrical the numbers are. This measure is in the shape of a bell curve. We can calculate this by using the equation below:
Skewness = 3(mean-median)/standard deviation.
Learning these concepts doesn’t mean you need to become a statistician. It means knowing how to use them in the real world to support your decisions.
How to Develop Statistical Thinking
Developing statistical thinking means learning to approach problems using data and evidence. It’s about becoming comfortable with numbers, asking the right questions, and using logical reasoning to draw valid conclusions.
Here are some practical ways graduates can build this essential skill in 2026:
1.) Handle Real-Life Data
The best way to develop statistical thinking is by working with practical life data. Start from your interest topics like sports stats, financial trends, or social media analytics. This makes learning more engaging and helps you connect abstract concepts with real-world applications.
Many platforms like Kaggle, UCI Machine Learning Repository, and government databases give free of cost datasets on different topics (sports, healthcare, engineering).
Tip for practicing with real-life data:
Choose data according to your interests (e.g., sports, healthcare, or finance) and begin explaining. Try to answer questions like,
- What is the average income in this dataset?
- Is there a correlation between the two variables?
2.) Take Short Courses
Taking short courses in statistical thinking is valuable because they provide a focused, practical introduction to analyzing data and drawing meaningful conclusions. They equip individuals with the skills to interpret data, make informed decisions, and communicate findings effectively in different fields, including data science, business, and research.
Online Platforms for Short Courses
Several online platforms offer short courses focused on developing statistical thinking. Platforms like DataCamp, Coursera, and JMP Statistical Discovery provide online classes. Students can learn statistical concepts, problem-solving skills, and data analysis techniques through the courses of these types of platforms.
3.) Ask Data-Driven Questions
Asking data-driven questions is essential for developing statistical thinking because it forces one to frame problems in a way that requires data analysis and interpretation. It encourages a shift from intuition and guesswork to evidence-based reasoning. It is the foundation of statistical thinking.
Train your mind to ask:
- What does the data say?
- Is this pattern significant?
- Could there be another explanation?
This kind of questioning leads to better decisions and stronger arguments, academically or professionally.
4.) Practice on a Daily Basis
All the above tips are beneficial, but they become useless if you don’t practice daily. Doing regular practice reinforces your understanding and improves problem-solving abilities. It helps you become more confident in applying statistical concepts.
Tips to make habit of regular practice:
To develop strong statistical thinking through regular practice, follow these key guidelines:
- Reserve a specific time each day for practicing statistics to build consistency
- Begin with simple problems to avoid feeling overwhelmed and gradually take on harder ones.
- Review your past work to identify mistakes, understand where you need more focus.
- Also, verify your answers to different statistics concepts by using online statistical platforms like criticalvaluecalculator.com, which provides calculators like mean, median, mode, standard deviation, and hypothesis testing.
- Try advanced problems to boost your problem-solving skills and deepen your understanding.
Final Words
Critical thinking is an essential skill for graduates. It helps you make better decisions, solve problems smartly by understanding complex information. With the use of statistical tools, you can take your critical thinking to the next level. It helps you find averages, predict outcomes, or test ideas with facts.
Statistical thinking supports logical and informed choices to become math experts. Begin by practicing with real data, enrolling in short courses, asking the right questions, and practicing regularly. These steps will enable you to think more clearly, support your ideas with facts, and achieve success in your studies & career.